COGS VARIANCE −3.2% DIAMONDTRAX · TOP 9TH 2–1 AP DUPLICATE FLAG $14,220 CAUGHT PACERONE · SPLIT 7:41/mi CONTROL TOWER ALERT LOGISTICS ▲ GYMTRAX · WEEK 6 +8% VOLUME TRADING SYSTEM · FILL 412 @ 88.14 CUSTOMER PROFIT RANK #1 SHIFTED COGS VARIANCE −3.2% DIAMONDTRAX · TOP 9TH 2–1 AP DUPLICATE FLAG $14,220 CAUGHT PACERONE · SPLIT 7:41/mi CONTROL TOWER ALERT LOGISTICS ▲ GYMTRAX · WEEK 6 +8% VOLUME TRADING SYSTEM · FILL 412 @ 88.14 CUSTOMER PROFIT RANK #1 SHIFTED
Business Analytics

Decision support tools that are powerful, affordable and actually support decisions. Radical concept

You know how to run your business. Our tools aim to be that final puzzle piece that gives you the efficiencies, insight and confidence to maintain & grow successes. To do so we understand that, insofar as possible, we have to give you the answer, not colorful graphs & numbers that you have to interpret yourself.

Costing & Profit System (CPS)

Prismata's first tool - built in 2003 ( updated since then :-) ), and arguably still the most powerful. Accurate and defensible cost and revenue allocation is one of the most enlightening exercises a company can do. What is the specific conversation you need to have with customer X in order to improve their profitability? What is the add-on product or service to product Y that needs to be recommended at point of sale to improve order profitability? How much of a fuel surcharge should you give to the delivery of order Z? Which branch is bringing home most of the net profit for your organization, and how do you emulate their efficiencies elsewhere? These are impossible questions to answer without precise allocation - and easy to answer with it. Used by companies as small as single owner health spas, and as large as international automibile manufacturers. Allocates at order line level detail using custom allocation methodologies, instead of forcing your business into generic allocation templates that are restricted to customers or products only. The result is a clear, precise read on where you actually make and lose money: by customer, product, service, area, route...

  • Identifies your true top and bottom performing customers, orders, products, vendors, and regions
  • Cost allocation methodology is fully user-defined, not a fixed template
  • Builds a step-by-step action plan for improving profit, not just a report of it
  • Works from transaction-level detail, so the numbers hold up under scrutiny
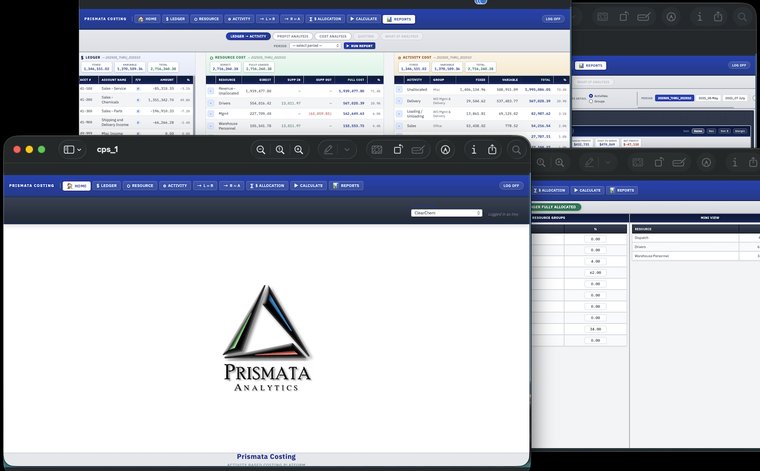
cps_1
Prismata Costing running on desktop⤢ View screens

Click through the ledger allocation, cost report, and profitability drill-down
aa_1
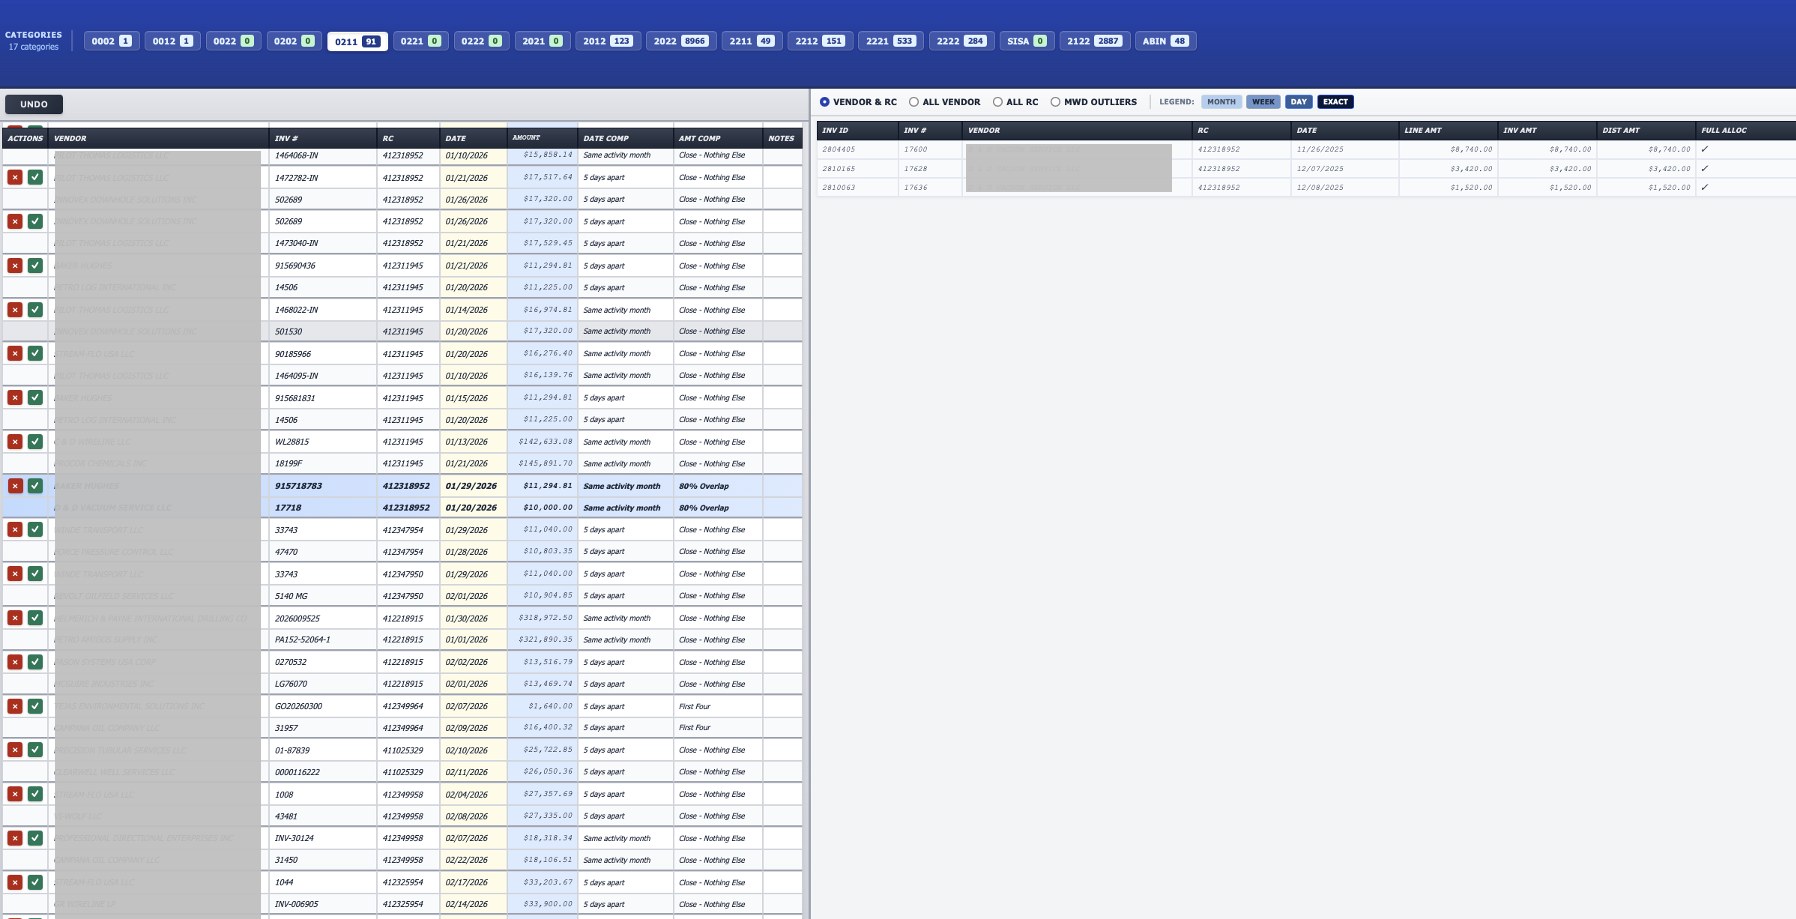
AP Analyzer duplicate invoice comparison screen⤢ View full size

Compares invoices across hundreds of custom vectors to catch what a manual review would miss.

AP Analyzer

Studies show that, on average, companies lose about .1% of AP to erroneous double payments. This number can be greater for companies with high invoice velocity and small AP departments. AP Analyzer is a lightweight check that reviews your accounts payable invoices and returns a listing of the ones that have likely been inadvertently paid or submitted twice. Many customers run it as a preventive tool on check-run day to catch errors before they go out the door.

  • Flags probable duplicate or inadvertent payments after the fact
  • Runs a preventive analysis before invoices go out, so you catch it before the money moves
  • Built to sit alongside your existing AP workflow rather than replace it

Automated Trading System (ATS)

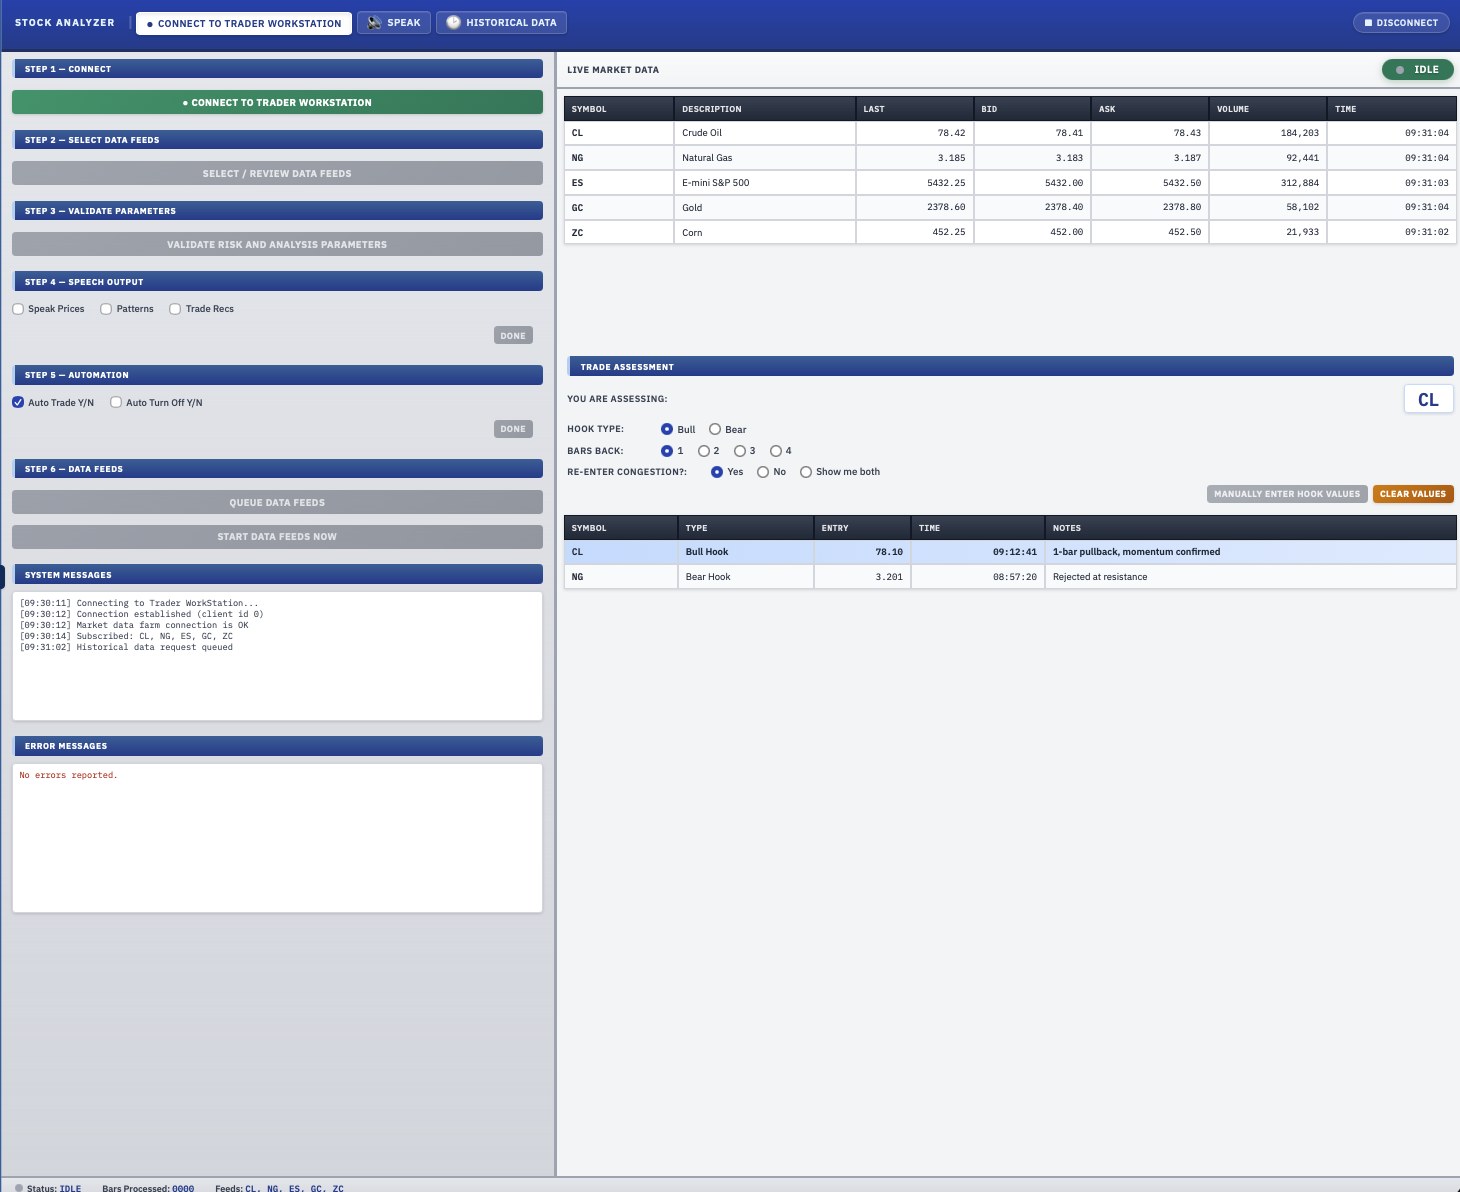
Most trading platforms allow you to define simplistic alerts, eg to ding when a price goes above or below a certain price point. Booooooooring. ATS allows for you to define highly technical and advanced price movement analysis to identify when a stock or future is in an advantageous setup based on your investment philosophy. ATS can automatically submit and manage your stock and futures trades for you, or simply let you know that the setup is ready for your own attention.

  • Custom price and volume movement analysis, tuned to your own criteria
  • Can automatically submit trades once your conditions are met
  • Can manage open positions in stocks and futures on an ongoing basis
  • Can alert you when a stock or future's price and volume movement matches your investment strategy
tt_1
Automated Trading System live market and hook assessment screen⤢ View full size

Connected to live market data with custom, advanced price & volume movements assessed in real time.

ct_4
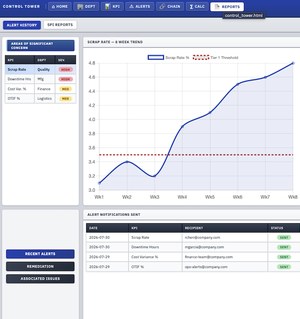
Control Tower reports and alert history screen⤢ View screens

Departments, KPIs, alerts, dependency chain, and reports

Control Tower

Born from CEO's frustration that department heads consistently report on time and under budget peformance, only to find out at quarter end that they miss their goal. Control Tower is an intelligent monitoring and alerting tool that sits above the whole business and watches every department, from engineering to sales to production to logistics, and compares actual performance to forecasts and budgets. When actuals are out of line with budgets and forecasts, based on severity and length of non-compliance, Control Tower alerts the right people at the right frequency. And it links all departments in a 'dependency chain', letting the departments up and downstream from the problem know that a variation from expectation is coming, so that those departments can make their own adjustments.

  • Watches all business activity against forecast and budget in real time
  • Alerts are targeted to the right people at the right frequency
  • Understands how departments connect, so an outlier upstream automatically alerts the up and downstream teams it will eventually affect